
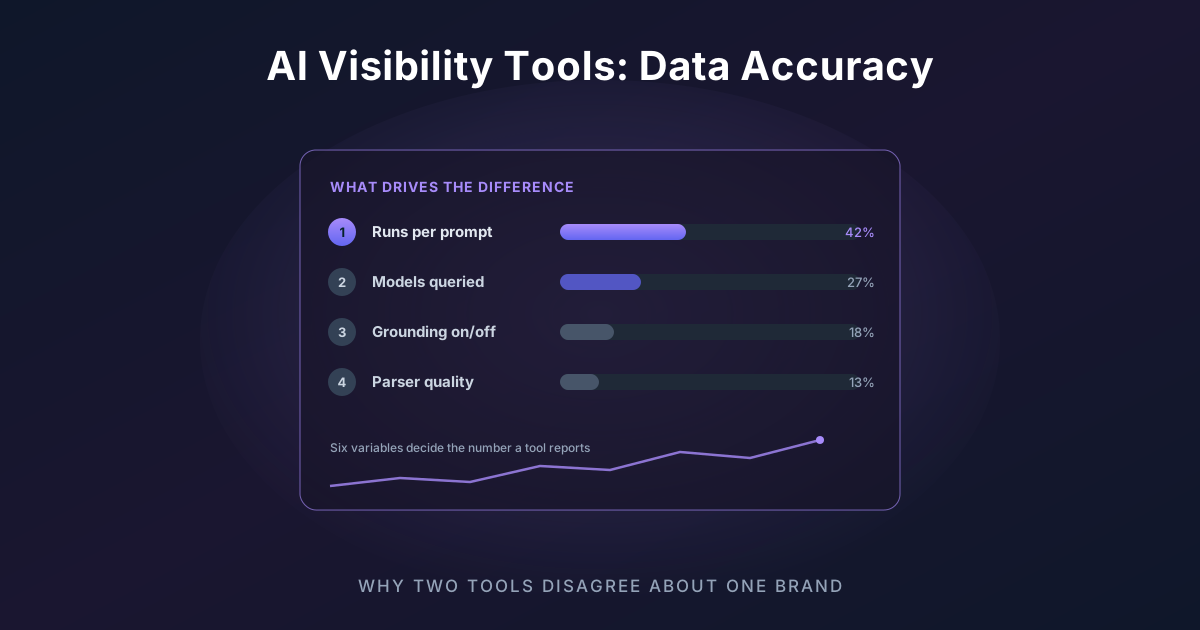
Why two tools disagree about the same brand
Run the same brand through two AI visibility platforms on the same day and you will get two different visibility scores. Teams treat this as evidence that one is broken. Usually neither is.
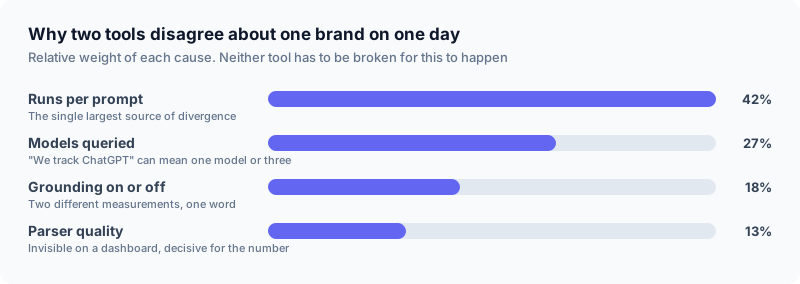
The measurements differ because the methodology differs, and almost nobody publishes theirs. Six variables drive nearly all the divergence, and once you can see them the disagreement stops being mysterious.
The six variables that decide your number
1. Sample size per prompt
The largest single factor. AI answers are non-deterministic - the same prompt produces different brand lists between runs.
| Runs per prompt | What the number means |
|---|---|
| 1 | A single draw from a distribution. Not a measurement. |
| 3 | Directionally useful, high variance |
| 5 | The practical floor for a reported number |
| 10+ | Stable, and expensive |
A tool sampling once and a tool sampling ten times will report different numbers for the same brand indefinitely, and the difference is not accuracy, it is precision. Ask any vendor how many runs sit behind a reported position. If the answer is unclear, that is the answer.
2. Which models are queried
"We track ChatGPT" can mean GPT-5 only, or GPT-5 plus mini plus Search. Those produce different shortlists. The cheaper models serve enormous volume, so a tool tracking only the flagship is measuring the surface fewest people use - and will systematically report different numbers from one that includes the small models.
Same problem across the family on every engine: Sonar versus Sonar Pro, Gemini Flash versus Pro, Grok 3 Mini versus Grok 4.
3. Grounding, on or off
Grounded answers search the live web first. Ungrounded answers come from model knowledge. They give substantially different results, especially for brands whose recent content is stronger than their historical footprint. A tool that grounds and a tool that does not are measuring two different things and calling both "visibility".
4. How position is parsed
The unglamorous variable that causes more error than any other. Models answer in numbered lists, in prose, in tables, with hedges and qualifiers. Extracting "the brand was recommended second" from a paragraph is genuinely hard.
Common parser failures, all of which produce confidently wrong numbers:
- Counting a brand named in a dismissal ("unlike Brand X, which lacks...") as a positive mention
- Missing a brand written with different casing, spacing, or a common misspelling
- Double-counting a brand named twice in one answer
- Failing on table-formatted answers entirely
- Treating a citation-list appearance as an answer mention
5. How the score is composed
Most tools report a composite "visibility score" built from mentions, position, sentiment, and citations at proprietary weights. Two tools can agree on every underlying observation and still produce different scores because they weight them differently. Composite scores are useful for tracking your own trend and near-useless for comparing across tools.
6. Prompt set and timing
Different prompts measure different things, obviously. Less obviously, when you sample matters: engines update, the web changes, and on Grok a live conversation can shift answers within hours. Two tools sampling twelve hours apart are sampling different worlds.
How to test a tool's accuracy yourself
Do not take a vendor's word for it, and do not assume the expensive tool is the accurate one. This takes an afternoon.
Establish ground truth manually. Pick five prompts. Run each ten times in the engine's own interface, in a fresh session every time. Record every brand named and its position. You now have 50 observations you gathered yourself.
Calculate your own numbers. Your presence rate is answers naming you, divided by 50. Your average position is the mean of your positions where named.
Run the same five prompts in the tool. Same wording, same day.
Compare. Expect the tool to be within a few percentage points of your presence rate. If it is wildly off, ask which of the six variables above explains it - usually sample size or model coverage, and both are answerable questions.
Test the parser deliberately. Find an answer where your brand is mentioned dismissively, and one where it appears in a table. Check what the tool recorded for both. Parser quality is invisible on a dashboard and decisive for whether the number means anything.
Test the citation capture. Count the sources in a live Perplexity answer. Count what the tool stored. Truncation is common and silently distorts every share metric built on top.
What to ask a vendor
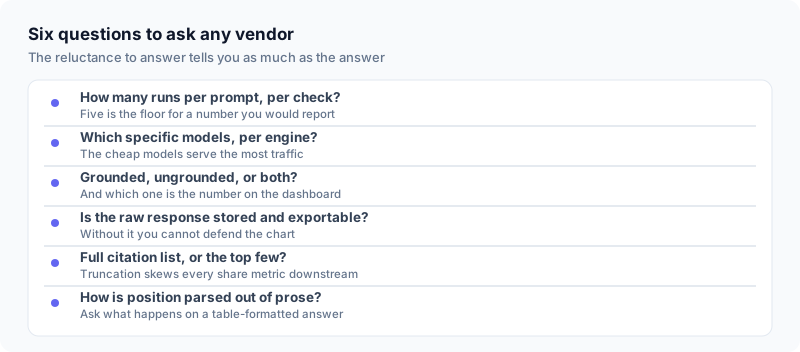
Six questions. The answers, or the reluctance to give them, tell you what you need to know.
- How many runs per prompt per check, exactly?
- Which specific models, per engine?
- Grounded, ungrounded, or both - and which does the reported number use?
- Is the full raw response stored and exportable?
- Is the complete citation list stored, or the top few?
- How is position parsed out of prose, and what happens on a table-formatted answer?
A tool that answers all six plainly is a tool whose numbers you can defend to someone else. That is the actual product in this category - not the dashboard, the defensibility.
What we do, since it is only fair to answer our own questions
Livesov runs each prompt several times per scheduled check, across multiple models per engine, on all five major engines. Every raw response is stored and exportable to CSV and PDF, the complete citation list is kept rather than the top few, and grounded mode on Gemini is a documented plan-level setting rather than a hidden default. Our full method is written up in how Livesov measures LLM visibility.
Test it against your own manual ground truth. That is the point of the exercise, and it applies to us the same as anyone.
FAQ
Why do AI visibility tools show different numbers?
Different sample sizes, model coverage, grounding settings, parsers, score formulas, and sampling times. Two tools can both be reporting honestly and still disagree, because they are measuring different things under the same word.
Which AI visibility tool is most accurate?
The right question is which is most transparent, because accuracy you cannot verify is a claim rather than a property. Prefer the tool that publishes its sampling method, stores raw responses, and lets you export the evidence - then check it against your own manual runs.
How many runs per prompt is enough?
Five is the practical floor for a number you would report. Three is directionally useful. One is a single draw from a distribution and should not be called a measurement.
Can I verify an AI visibility tool myself?
Yes, and you should. Run five prompts ten times each manually, calculate your own presence rate and average position, and compare. Any tool worth paying for lands close to your ground truth.
Should I use two tools to cross-check?
Only if you can afford it and enjoy reconciling methodologies. A better use of the same money is one tool you have verified against your own manual runs, sampling deeply enough to trust. Two unverified tools produce two numbers and no truth.