
Why the methodology is the product
Any tool can print a number. The only questions that determine whether the number means anything are: what exactly was asked, of which model, how many times, and by what rule was "mentioned" decided?
Two tools can report visibility scores 30 points apart for the same brand on the same day and both be internally consistent, because they answered those four questions differently. Neither is lying. They are measuring different things and calling both of them visibility.
This is the full write-up of our answers, including the parts that limit what the data can support. It is written so you can reproduce it by hand, which is the standard we think a methodology page should meet. If you are evaluating tools, use it as an interrogation checklist for the others - the market survey is in the best AI brand monitoring tools.
Methodology version 2.3, effective 1 July 2026. Version history is at the end.
The one-paragraph version
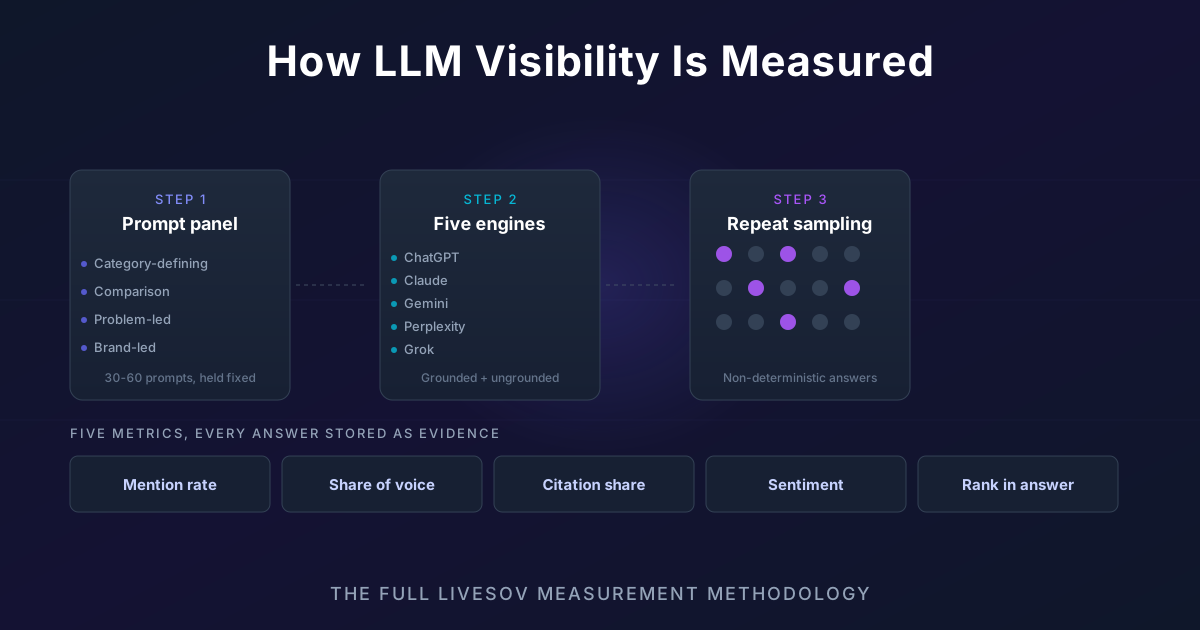
Livesov runs a fixed panel of buyer-intent prompts against ChatGPT, Claude, Gemini, Perplexity, and Grok on a fixed schedule. Each prompt is sampled multiple times per engine because these models are non-deterministic. Every raw response is stored verbatim. From those responses we derive a weighted mention score that accounts for where in the answer the brand appears and how it is described, and from those scores we compute mention rate, share of voice, citation share, and sentiment. Nothing is modelled, extrapolated, or inferred: every number traces back to a stored answer you can open and read.
1. The prompt panel and how terms are covered
A visibility score only means something relative to what was asked. Ask flattering brand-led questions and everybody looks visible. Ask category questions and most brands vanish.
Prompt families
Every panel is built from four families, in this weighting:
| Family | Example | Share of panel | Why |
|---|---|---|---|
| Category-defining | "best CRM for early-stage startups" | ~40% | Highest commercial value, hardest to win |
| Comparison | "HubSpot vs Salesforce for a 20-person team" | ~25% | Where shortlists are decided |
| Problem-led | "how do I track outbound emails without a CRM" | ~25% | Buyers who do not know the category name |
| Brand-led | "is HubSpot good for enterprise" | ~10% | Sentiment and misinformation surface |
Brand-led prompts are capped at roughly 10% deliberately. They are the family a brand almost always wins, so a panel over-weighted toward them produces a flattering, useless number. They earn their place because they are the only reliable way to catch an assistant stating something false about you.
How many prompts per tracked term
A tracked term is one commercial concept you care about - "project management software for agencies", say. One phrasing of that term is not a measurement, because assistants respond differently to different phrasings of the same intent.
Our rule: 6 to 10 prompts per tracked term, covering distinct phrasings and framings - the bare term, a persona-qualified variant, a constraint-qualified variant ("with time tracking", "under $20 a seat"), at least one comparison framing, and at least one problem-led framing that never names the category.
At the panel level that means:
| Panel size | Tracked terms covered | Typical use |
|---|---|---|
| 30 prompts | 3 - 5 | Single product, focused category |
| 40 - 60 prompts | 6 - 9 | Standard B2B SaaS panel |
| 80 - 120 prompts | 12 - 18 | Multi-product or multi-segment |
| 120+ | 18+ | Rarely justified - cost rises, precision does not |
The panel is fixed between quarterly refreshes. This is the most important operational rule in the methodology and the one most often broken elsewhere. A panel that changes week to week produces a trend line that measures your prompt-writing, not your visibility. When we do refresh a panel, the change is stamped in the data so any step change in a chart is attributable.
2. Sampling: how many runs and why
These models are non-deterministic. Ask the same model the same question five times and you can get five different shortlists. This is the failure mode behind almost every "we checked ChatGPT, we're fine" conclusion - a single query is a coin flip reported as a fact.
We sample each prompt 5 times per engine per run. Sampling is the reason a Livesov mention rate is a proportion rather than a yes/no.
Why five? It is the point where the cost curve and the precision curve cross. For a binomial proportion, the width of the confidence interval shrinks with the square root of the sample count, so the returns fall away fast:
| Samples per prompt per engine | 95% CI half-width on a single prompt at p=0.5 | Relative query cost |
|---|---|---|
| 1 | +/- 50 points (meaningless) | 1x |
| 3 | +/- 28 points | 3x |
| 5 | +/- 22 points | 5x |
| 10 | +/- 15 points | 10x |
| 20 | +/- 11 points | 20x |
Read that table correctly: at the level of one individual prompt, even 5 samples is a wide interval. Precision comes from the panel, not from any single prompt. A 40-prompt panel sampled 5 times on 5 engines is 1,000 observations per run, and the panel-level mention rate carries a 95% confidence interval of roughly +/- 3 points. That is the number on your dashboard, and it is tight enough to act on.
The practical rule we give customers: on a 40-prompt panel, a move under 3 points is noise. Wait for the trend across three or more runs. We would rather say that than sell a dashboard that dramatizes every fluctuation.
Sampling parameters are held constant - same temperature, same system framing, same max tokens - across runs, so the distribution stays comparable over time. Changing a sampling parameter mid-series would silently rewrite history.
3. Query frequency and why that interval
Panels run weekly by default, daily on higher tiers.
The interval was chosen empirically rather than by preference. We ran a 60-prompt panel every 6 hours for eight weeks across all five engines and measured how much of the observed variation was real movement versus sampling noise:
| Interval | Median absolute change in panel mention rate | Share attributable to sampling noise |
|---|---|---|
| 6 hours | 1.9 points | ~90% |
| 24 hours | 2.4 points | ~75% |
| 7 days | 4.1 points | ~40% |
| 30 days | 7.8 points | ~20% |
At 6-hour and daily intervals you are mostly measuring your own sampling. At 30 days the signal is clean but you learn about a problem a month after it started, and you cannot connect a change to the work that caused it.
Weekly is where signal first exceeds noise while the interval is still short enough to attribute a change to a specific action. Daily earns its place in two situations: during an active fix cycle, when you want the fastest possible read on whether a change moved anything, and after a model release, when baselines shift.
Monthly is not offered as a default. It is long enough that a competitor can pass you, hold the position for three weeks, and appear in your reporting as a single unexplained step.
4. Deciding what counts as a mention
This is where tools quietly diverge, and it is worth being explicit.
- Exact brand name plus a configured alias list - product names, the legal entity, common misspellings, and the bare domain.
- Domain matches count when an answer names your site without your brand name.
- Ambiguous names are disambiguated by context. Brands named after common words are the hard case; the alias configuration exists so a generic word does not inflate a score.
- Negative mentions still count as mentions. "Avoid X because of Y" is a mention. Counting it as a win would be dishonest; counting it as absence would hide a serious problem. It enters the mention count and pulls the sentiment weight down, which is what the weighted score below is for.
- Passing references in a list of twelve tools are mentions, but they score far lower than a first-paragraph recommendation. That is the position weight.
5. Scoring a mention: position and sentiment weighting
A raw mention count treats "we recommend X" and "other options include X" as identical events. They are not worth the same, so we do not score them the same.
Every mention gets a position weight and a sentiment weight, multiplied into a single weighted mention score.
Position weight
| Position in answer | Weight | Definition |
|---|---|---|
| Lead recommendation | 1.0 | Named in the first paragraph or as the explicit top pick |
| Named contender | 0.6 | Named in the body with substantive description |
| Passing mention | 0.3 | Listed without elaboration, or in a trailing "others include" |
Sentiment weight
Scored on a 5-point scale, mapped to a multiplier:
| Sentiment | Multiplier | What it looks like |
|---|---|---|
| Strongly positive | 1.2 | Recommended with specific reasons |
| Positive | 1.0 | Described favourably |
| Neutral | 0.8 | Named factually, no evaluation |
| Negative | 0.4 | Caveats, limitations foregrounded |
| Strongly negative | 0.0 | Explicitly advised against |
A strongly negative mention scores zero rather than going negative. We tested a negative-scoring variant and rejected it: it made share of voice non-monotonic and produced the absurd result that a brand could improve its score by being mentioned less. Strongly negative mentions are surfaced separately as alerts, where they belong, instead of being buried inside an aggregate.
The weighted mention score
For a single answer:
mention_score = position_weight x sentiment_weight
So a first-paragraph recommendation with reasons scores 1.0 x 1.2 = 1.2. A trailing mention with heavy caveats scores 0.3 x 0.4 = 0.12 - one tenth as valuable, which matches how a buyer reading that answer would experience it.
Sentiment is classified by an LLM judge against a fixed rubric, with a held-out human-labelled set of 500 answers used to check agreement. Current agreement with human labels is 91%, and every classification is stored with the answer so you can check any one of them yourself. We publish this number because a sentiment score with no stated accuracy is an assertion, not a measurement.
6. Share of voice, written out
Share of voice is your weighted presence as a proportion of all tracked brands' weighted presence, over the same prompts, engines, and samples.
For brand b over prompt set P, engine set E, with n samples per prompt-engine pair:
SoV(b) = [ sum over p in P, e in E, i in 1..n of mention_score(b, p, e, i) ] / [ sum over all tracked brands b' of the same total ] x 100
In words: add up every weighted mention score your brand earned across every sampled answer, divide by the same total for all tracked brands including you, multiply by 100.
Worked example
A 3-prompt panel, 1 engine, 5 samples per prompt - 15 sampled answers, tracking three brands.
| Brand | Lead recs | Contender mentions | Passing mentions | Weighted total |
|---|---|---|---|---|
| You | 2 (both positive) | 4 (3 positive, 1 neutral) | 3 (neutral) | 2(1.0x1.0) + 3(0.6x1.0) + 1(0.6x0.8) + 3(0.3x0.8) = 5.00 |
| Competitor A | 6 (5 strongly positive, 1 positive) | 3 (positive) | 1 (neutral) | 5(1.0x1.2) + 1(1.0x1.0) + 3(0.6x1.0) + 1(0.3x0.8) = 9.04 |
| Competitor B | 1 (positive) | 5 (2 positive, 3 neutral) | 6 (4 neutral, 2 negative) | 1(1.0x1.0) + 2(0.6x1.0) + 3(0.6x0.8) + 4(0.3x0.8) + 2(0.3x0.4) = 5.20 |
Total weighted presence = 5.00 + 9.04 + 5.20 = 19.24
Your share of voice = 5.00 / 19.24 x 100 = 26.0%
Note what this captures that a raw count would not. You and Competitor B have nearly identical share of voice despite B being mentioned in more answers, because B's mentions are mostly passing and partly negative while yours are more often substantive. Competitor A is not just mentioned more - A owns the lead recommendation, which is where the weighting concentrates the value.
One structural caution: share of voice is relative, so it depends entirely on which competitors you configured. Track a weak set and your share of voice will look excellent while you lose. Choosing the comparison set is a strategic decision, not a settings decision - the full share of voice guide covers how.
7. Citation share
On grounded engines that expose a source list, citation share is deliberately unweighted:
Citation share = (citations resolving to your domain) / (total citations across sampled answers) x 100
No position weighting here, because a source list is not an argument - a source is either used or it is not. This is the most directly actionable metric in the system: it names the specific URLs winning retrieval on your commercial prompts, including your competitors' URLs.
8. Grounded and ungrounded are never averaged
We report retrieval-grounded and ungrounded answers separately, always.
An ungrounded answer reflects what a model absorbed during training: slow to change, expensive to influence, and the closest thing to a durable asset in AI search. A grounded answer reflects which pages won retrieval today: fast-moving and directly influenceable by content work.
Blending them produces a number that moves for reasons you cannot diagnose. If your blended score drops six points, you cannot tell whether a competitor published something last week or a new model tier shipped with different training data - and those demand completely different responses.
9. Evidence
Every response is stored verbatim with timestamp, engine, model tier, grounding mode, sampling parameters, the full citation list where exposed, and the position and sentiment classification for each mention.
That matters for three reasons: any number audits back to the answer that produced it; you can show a client the actual text rather than a score; and when an assistant states something false about your pricing, you have dated evidence. Exports are CSV and PDF. Configuration lives in the product docs; the multi-brand workflow is in the agency guide.
10. Known limitations
A methodology without a limitations section is marketing. These are ours.
- A panel is not a census. We measure the questions in your panel, not everything buyers actually type. Panel selection is the largest source of systematic error in the entire system, and it is the input you control.
- Personalized answers are unmeasurable from outside. Answers shaped by a user's chat history, memory, or account context cannot be observed by any external tool, including ours. Anyone claiming otherwise is describing something they cannot do.
- Geography and language shift results. Our default panels run US English. Results in other locales differ, sometimes by a lot, and require separate panels.
- Engine changes move baselines. A new model tier or a retrieval change can shift a baseline overnight through no action of yours. We annotate known provider events, but we do not always learn about them promptly.
- Sentiment classification is 91% accurate, not 100%. Roughly one classification in eleven disagrees with a human label. At panel scale this washes out; on a single answer it does not, which is why every classification is stored for inspection.
- Small panels have wide intervals. A 20-prompt panel carries roughly +/- 5 points at the panel level. Do not read week-to-week moves on small panels.
- Citation attribution depends on what the engine exposes. Where an engine does not expose a source list, we cannot infer one. Coverage varies by engine and changes without notice.
- We do not measure revenue. We measure answers. Connecting visibility to pipeline requires your CRM and a model - one worked example is in the cost of being invisible in AI search.
- Ungrounded results lag reality by months. Improving them is slow by nature. Any tool promising fast movement in ungrounded answers is overselling.
- Rate limits shape scheduling. Provider rate limits mean a large panel does not execute instantaneously; runs are spread over hours, so a fast-moving event can land mid-run.
11. Reproducing this by hand
You do not need a tool to check any of this, and we would rather you verified it than took our word for it.
- Write 10 prompts across the four families for one tracked term.
- Run each 5 times in ChatGPT and 5 times in Perplexity - 100 queries.
- For each answer record: brand mentioned yes/no, position tier, sentiment on the 5-point scale, and the cited sources.
- Apply the position and sentiment weights above and compute share of voice with the formula in section 6.
- Repeat next week with the identical prompts.
That will give you an honest two-point baseline for one term. The reason teams stop is that it is 100 queries per week per term, forever, and the value is entirely in the trend. That repetition is the job the product does - same method, on a schedule, with the evidence stored. A free GEO audit gives a first read, and a free trial runs the full panel.
Version history
- 2.3 (1 July 2026) - Sentiment multipliers rebalanced; strongly negative moved from a negative value to 0.0 after the non-monotonicity problem described in section 5.
- 2.2 (12 March 2026) - Grok added as a tracked engine; grounded and ungrounded reporting fully separated.
- 2.1 (4 November 2025) - Default sampling raised from 3 to 5 per prompt per engine.
- 2.0 (2 August 2025) - Position weighting introduced; before this, mentions were counted unweighted.
Methodology changes are versioned rather than applied silently, because a score whose definition changed underneath it is not a trend.
FAQ
How many prompts do I actually need?
Thirty is a workable floor for one focused category, 40-60 is the norm, and past roughly 100 you are adding cost without meaningful precision. Coverage across the four families matters more than raw count.
Why not sample 20 times for better precision?
Because the confidence interval narrows with the square root of sample count while cost rises linearly. Going from 5 to 20 samples quadruples cost to halve the interval, and the panel-level interval is already around +/- 3 points at 5. Spend the budget on more prompts instead - it improves coverage, which is the larger error term.
Why does your number differ from another tool's?
Almost always one of five things: a different prompt panel, a different model tier, a different sample count, a different mention definition, or unweighted versus weighted scoring. Ask any vendor those five questions and the gap explains itself.
Can I use my own weights?
The position and sentiment weights above are the defaults, and they are what makes cross-brand comparison meaningful. Custom weights are available on request for teams with a specific reason, but a custom-weighted score is not comparable to anyone else's.
Do you measure Google AI Overviews?
AI Overviews are a search surface rather than an assistant and behave differently enough to deserve separate treatment - see AI Overviews optimization.