
The short answer
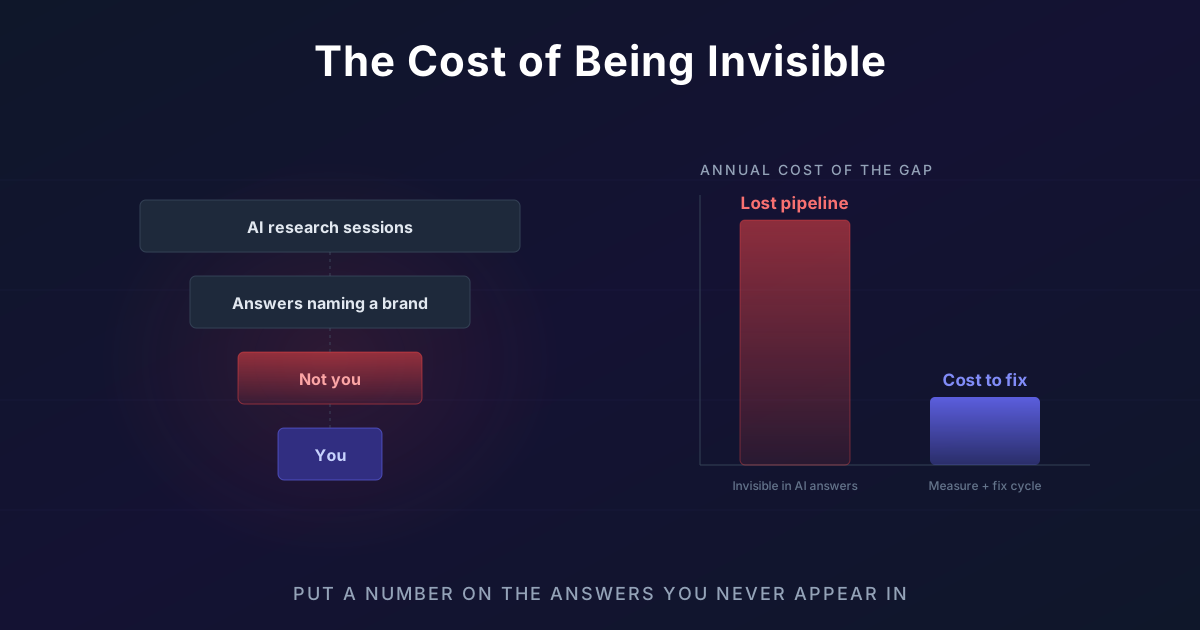
Invisibility in AI search is not a soft brand problem. It is a quantifiable revenue leak, and the arithmetic is not complicated:
Annual cost of invisibility = (buyer prompts in your category per month) x (the share of them you are absent from) x (your fair-share capture rate) x (session-to-opportunity rate) x (average deal value) x (win rate) x 12
The hard part is the second term. Nothing in Google Analytics, Search Console, or your CRM records an answer that named three competitors and not you. There is no impression, no click, no referrer, no line in any report. The loss is complete and completely silent.
So we measured it directly. This piece walks through a single category - project management SaaS - with a real prompt panel, real absence rates from our own tracking, a revenue model that turns missing citations into pipeline value, and a side-by-side comparison against what the same brand already spends buying the identical intent from Google Ads.
Why this cost never shows up in a report
Traditional SEO had a legible failure mode. You did not rank, you saw it in Search Console, you knew the position and the query and roughly what it was worth. AI search removed the feedback loop but kept the demand.
Three shifts produced the gap:
- Zero-click is now the default outcome. 58% of US searches end without a click to a non-Google property, and click-through to the top organic result falls an average of 34.5% when an AI Overview appears. Sources on the AI search statistics page.
- Shortlists are assembled inside the assistant. 52% of B2B technology buyers use generative AI during consideration. By the time a buyer reaches a website, the field has usually been narrowed to two or three names.
- Absence produces no telemetry. A ranking drop generates a chart. An answer that omits you generates nothing at all.
That is why this cost goes unbudgeted year after year. It is not that teams weigh the risk and accept it - it is that no report they run has ever raised it.
The category we measured: project management SaaS
We picked project management software because it is large, mature, competitive, and heavily researched through assistants. Buyers ask open category questions, the category has clear feature axes, and the paid search market for it is expensive enough to give us a clean cost comparison.
Category context, from Google Ads Keyword Planner and our own SERP sampling in August 2026:
| Commercial query | Monthly US volume | Google Ads CPC (avg) | Triggers AI Overview |
|---|---|---|---|
| best project management software | 33,100 | $22 - $28 | Yes |
| project management software for small business | 12,100 | $18 - $24 | Yes |
| best project management tools for remote teams | 5,400 | $16 - $21 | Yes |
| asana vs monday | 4,400 | $9 - $14 | Sometimes |
| project management software with time tracking | 3,600 | $19 - $26 | Yes |
| free project management software | 27,100 | $6 - $11 | Yes |
Roughly 85,000 monthly searches across just six head terms, most of them now returning an AI answer above the organic results, at a paid clearing price of $6 to $28 per click. Hold those CPCs - they become the benchmark later.
The tracked subject is a real customer: a mid-market project management SaaS, roughly $9M ARR, $14,200 average contract value, selling to teams of 20 to 200. They have asked not to be named, so we call them Brand X throughout. Every figure below is from their live Livesov panel.
What we measured: absence, not presence
Most visibility reporting leads with presence, which flatters everyone. We inverted it. The metric that matters for a cost model is absence rate: the share of sampled answers to real buyer prompts in which the brand is not named at all.
The panel: 42 prompts, sampled 5 times each, across 5 engines (ChatGPT default and Search, Claude, Gemini, Perplexity, Grok), run over 4-10 August 2026. That is 42 x 5 x 5 = 1,050 sampled answers. The full sampling method is documented in how we measure LLM visibility.
Table 1: Brand X absence rate by prompt family
| Prompt family | Prompts | Sampled answers | Answers naming Brand X | Absence rate |
|---|---|---|---|---|
| Category-defining ("best PM software for X") | 16 | 400 | 34 | 91.5% |
| Comparison ("Asana vs Monday vs ...") | 9 | 225 | 27 | 88.0% |
| Problem-led ("how do I keep 5 projects on track") | 11 | 275 | 61 | 77.8% |
| Brand-led ("is Brand X any good") | 6 | 150 | 148 | 1.3% |
| Total (excluding brand-led) | 36 | 900 | 122 | 86.4% |
Read the last two rows together, because that contrast is the entire story of this category.
When a buyer already knows Brand X and asks about it by name, the assistants answer confidently - 98.7% presence. Brand X's marketing team saw exactly this when they spot-checked ChatGPT, and concluded they were fine.
But on the 36 prompts where a buyer is choosing a vendor rather than checking one, Brand X is absent from 86.4% of answers. They are visible only to people who already know them. In a category where the assistant is increasingly the thing that produces the shortlist, that is a growth ceiling, not a visibility problem.
Table 2: who occupies the answers Brand X is missing from
The same 900 sampled answers, counting which domains were cited as sources on the grounded engines (Perplexity, ChatGPT Search, Gemini grounded):
| Cited source type | Share of citations | Notes |
|---|---|---|
| Review platforms (G2, Capterra, TrustRadius) | 24.6% | Dominant on "best" and "vs" prompts |
| Reddit and community threads | 21.9% | Highest on problem-led prompts |
| Independent blog and comparison sites | 18.4% | Affiliate roundups over-represented |
| Vendor-owned domains (all vendors combined) | 11.7% | Brand X's own share of this: 0.9% |
| YouTube | 7.2% | Transcript-cited, mostly demos |
| Major publishers and trade press | 6.8% | Concentrated in Gemini answers |
| Documentation and help centres | 4.9% | Mostly on problem-led prompts |
| Other | 4.5% | Long tail |
Two findings drove Brand X's roadmap more than anything else in the engagement. First, vendor-owned content is 11.7% of citations - your own website is a minority input to the answer about your own category. Second, Brand X owns 0.9% of citations in its own category, which is the mechanical reason for the 86.4% absence rate. They are not being outranked. They are not present in the source pool the answers are assembled from.
The revenue model: from missing citations to pipeline
Now convert absence into money. Six inputs, each defensible.
| Input | Symbol | Brand X value | Where it came from |
|---|---|---|---|
| Category buyer prompts per month | P | 17,000 | 85,000 head-term searches x 20% AI-mediated share |
| Absence rate on non-brand prompts | A | 86.4% | Table 1, measured |
| Fair-share capture rate | F | 9.0% | Brand X's Google share of voice on the same query set |
| Session-to-opportunity rate | C | 2.4% | Their existing organic-to-opportunity rate, CRM |
| Average contract value | V | $14,200 | CRM |
| Win rate | W | 21% | CRM |
The conservative choice is P. The 20% AI-mediated share is at the low end of what we see for a category this heavily researched; the number would be defensible at 30% and we deliberately did not use it.
Step 1 - prompts they are absent from: 17,000 x 86.4% = 14,688 per month.
Step 2 - the recoverable share. Brand X will never be in every answer. Their fair share, benchmarked on their existing organic position for identical queries, is 9%. So the recoverable slice is 14,688 x 9% = 1,322 buyer prompts per month where they should reasonably be named and are not.
Step 3 - opportunities: 1,322 x 2.4% = 31.7 opportunities per month.
Step 4 - expected revenue: 31.7 x $14,200 x 21% = $94,529 per month.
Annual cost of invisibility for Brand X: roughly $1.13M.
Against $9M ARR, the leak is about 12.5% of current revenue in forgone new pipeline value each year. That number survived their CFO, which is the only review that matters, and it survived mainly because every input except P came from their own CRM and Search Console rather than from a market forecast.
A sensitivity check, because one number is not an argument
The honest way to present a model like this is with a range, not a point estimate. Varying the two softest inputs:
| AI-mediated share (P) | Fair-share capture (F) | Annual cost |
|---|---|---|
| 10% | 6% | $377K |
| 15% | 9% | $848K |
| 20% | 9% | $1.13M |
| 25% | 12% | $1.88M |
| 30% | 12% | $2.26M |
Even the pessimistic corner - half our AI-mediated share estimate and a two-thirds haircut on fair share - lands at $377K a year. The decision does not change anywhere in the grid, which is the useful property of a model whose worst case is still an obvious yes.
The part that changes the conversation: what they already pay for the same intent
Brand X does not consider this demand hypothetical. They buy it every month, from Google, at auction.
They spend approximately $41,000 per month on paid search against these same six head terms and their variants. At a blended $19 CPC that is around 2,160 clicks per month. Applying the same 2.4% session-to-opportunity rate, 21% win rate and $14,200 ACV, those clicks produce roughly $154,600 in expected monthly revenue - a return of about 3.8x on ad spend, which is a respectable, unremarkable B2B SaaS number.
Now put the two channels side by side.
Table 3: buying the intent vs earning the answer
| Paid search (current) | AI visibility (proposed) | |
|---|---|---|
| Monthly cost | $41,000 | ~$3,400 blended (tooling + 0.4 FTE content) |
| Monthly expected revenue | $154,600 | $94,500 at full recovery |
| Cost per opportunity | $1,180 | $107 |
| Return | 3.8x | ~28x at full recovery |
| Cost behaviour | Linear - stops the day you stop paying | Compounding - citations persist |
| Time to effect | Immediate | 60-120 days observed |
| Ceiling | Auction price and budget | Category authority |
Three caveats belong with that table, or it is propaganda rather than analysis.
One: the AI column is potential, not booked. Full recovery of the fair-share slice is the optimistic end; at the halfway mark it is a 14x return, which is still four times paid search.
Two: the channels are not substitutes. Paid search converts today and is controllable. AI visibility compounds and is not. The argument is not to move the $41,000 - it is that the next $3,400 of marginal budget has a dramatically better expected return in the channel nobody is bidding on yet.
Three: the cost-per-opportunity comparison flatters AI visibility because the tooling cost is fixed while the paid cost scales with volume. At 10x the pipeline, paid search costs 10x more and AI visibility costs roughly the same. That asymmetry is the actual finding.
What "fixing it" concretely means
For Brand X, the work that moved the numbers was unglamorous and mostly not on their own website:
- Own the review-platform surface. 24.6% of citations came from G2, Capterra, and TrustRadius. Their profiles were thin and their review volume was a third of the category leaders'. This was the single highest-leverage item and it is not a content project.
- Get into the comparison pool. Independent comparison and roundup sites accounted for 18.4% of citations. Brand X was missing from most of the roundups that assistants pull from, for the simple reason that nobody had ever asked to be included.
- Rewrite the eight pages that could plausibly be cited. Direct answers in the first 60 words, explicit comparison tables, specific facts with figures. Extractable beats persuasive - the GEO optimization playbook covers the format.
- Correct the record. Three engines described a pricing tier retired 14 months earlier. Assistants repeat stale facts with total confidence; see fixing negative brand sentiment in AI.
- Re-measure on the same fixed panel. Not a new panel. The same 42 prompts, so the trend line measures the work rather than the prompt-writing.
At 90 days, Brand X's absence rate on non-brand prompts had moved from 86.4% to 71.2%, and their share of vendor-domain citations from 0.9% to 4.1%. Applying the model unchanged, that is about $199K in annualised recovered pipeline value against roughly $10,200 of quarterly cost. The remaining gap is still large, which is the honest state of a category where review platforms and Reddit hold nearly half the citations.
When invisibility is genuinely cheap
This model does not apply everywhere, and pretending otherwise would be exactly the overselling this category is prone to.
The cost is small or zero if you sell into a category where buyers do not trust assistants (heavily regulated, high-liability, or relationship-sold), if your pipeline is predominantly outbound or partner-sourced, if your ACV is low enough that a 2% opportunity rate on a few thousand prompts is rounding error, or if you already occupy the answers - some brands genuinely do, and for them this is a monitoring exercise rather than a growth one.
The way to tell which world you are in is to measure absence on your own category prompts. If you are named in most answers, spend the money somewhere else and treat this as insurance.
Running this model on your own brand in a week
- Build the prompt panel. 30-50 real buyer questions, weighted to category-defining and comparison families. Exclude brand-led prompts from the absence calculation - they will flatter you by 60 points.
- Measure absence, not presence, across at least ChatGPT and Perplexity, with repeated sampling. A single check is a coin flip reported as a fact.
- Pull F, C, V, W from Search Console and your CRM. These are the inputs that make the model yours rather than an industry average.
- Pull your paid spend for the same intent. This is the comparison that ends the debate about whether the demand is real - you are already paying for it.
- Present one annual number, a sensitivity grid, and the cost to fix. Three artefacts, one slide.
- Re-measure monthly on the fixed panel.
Steps 1 and 2 are where teams stall. A free 90-second AI visibility audit gives you a first read, the share of voice calculator sketches the arithmetic, and a free trial runs the full sampled panel - no card required.
FAQ
Is this not just SEO ROI with new labels?
The structure is identical; the inputs are not. SEO ROI starts from impressions and clicks that already exist in Search Console. This starts from answers that generate no telemetry at all, so the measurement step - not the arithmetic - is the hard part and the reason the cost stays unbudgeted.
The 20% AI-mediated share is doing a lot of work. How confident are you?
Not very, which is why the sensitivity grid exists and why we used the low end. It is the softest input in the model. Everything else came from Brand X's own systems. If your leadership disputes it, run the model at 10% - if the answer is still large, the number was never the crux.
Why measure absence rate instead of mention rate?
They are the same measurement, but absence is the one that maps to a cost. Mention rate reports a 13.6% success; absence rate reports an 86.4% leak. Same data, and only one of them gets a budget approved.
Does the paid search comparison hold outside SaaS?
The shape holds anywhere clicks are expensive and AI answers are common - legal, insurance, health, B2B services. It weakens where CPCs are low: if you are buying intent at $1.20, the marginal case for AI visibility rests on compounding and durability rather than on cost per opportunity.
How long before the numbers move?
We see the first measurable movement at 60-120 days on grounded engines, where retrieval refreshes quickly. Ungrounded model answers move far more slowly, because you are waiting on the corpus itself to change. Anyone promising fast movement there is selling you something.